Community
Who likes onWatch
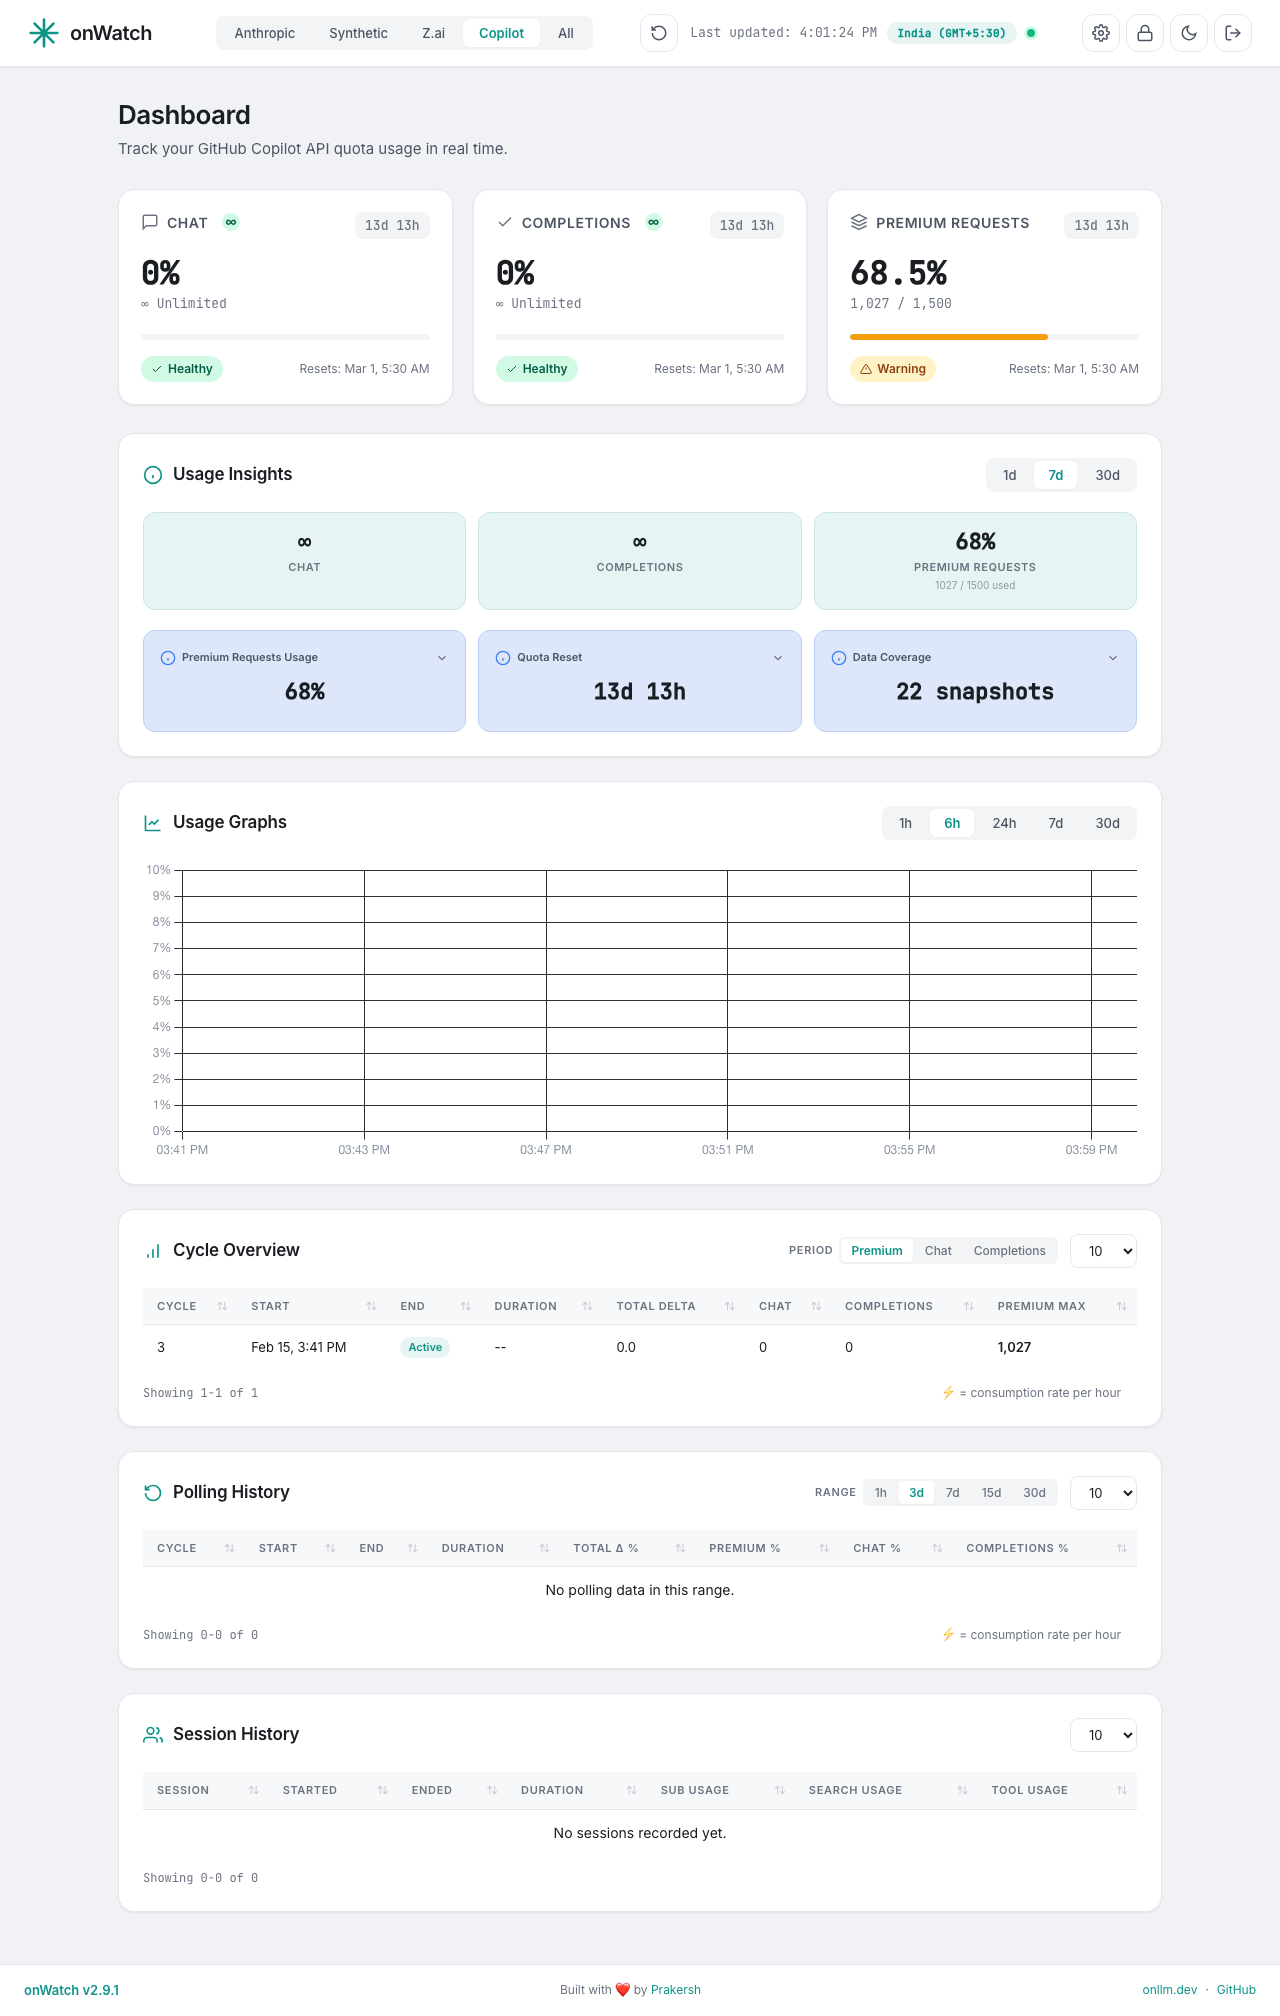
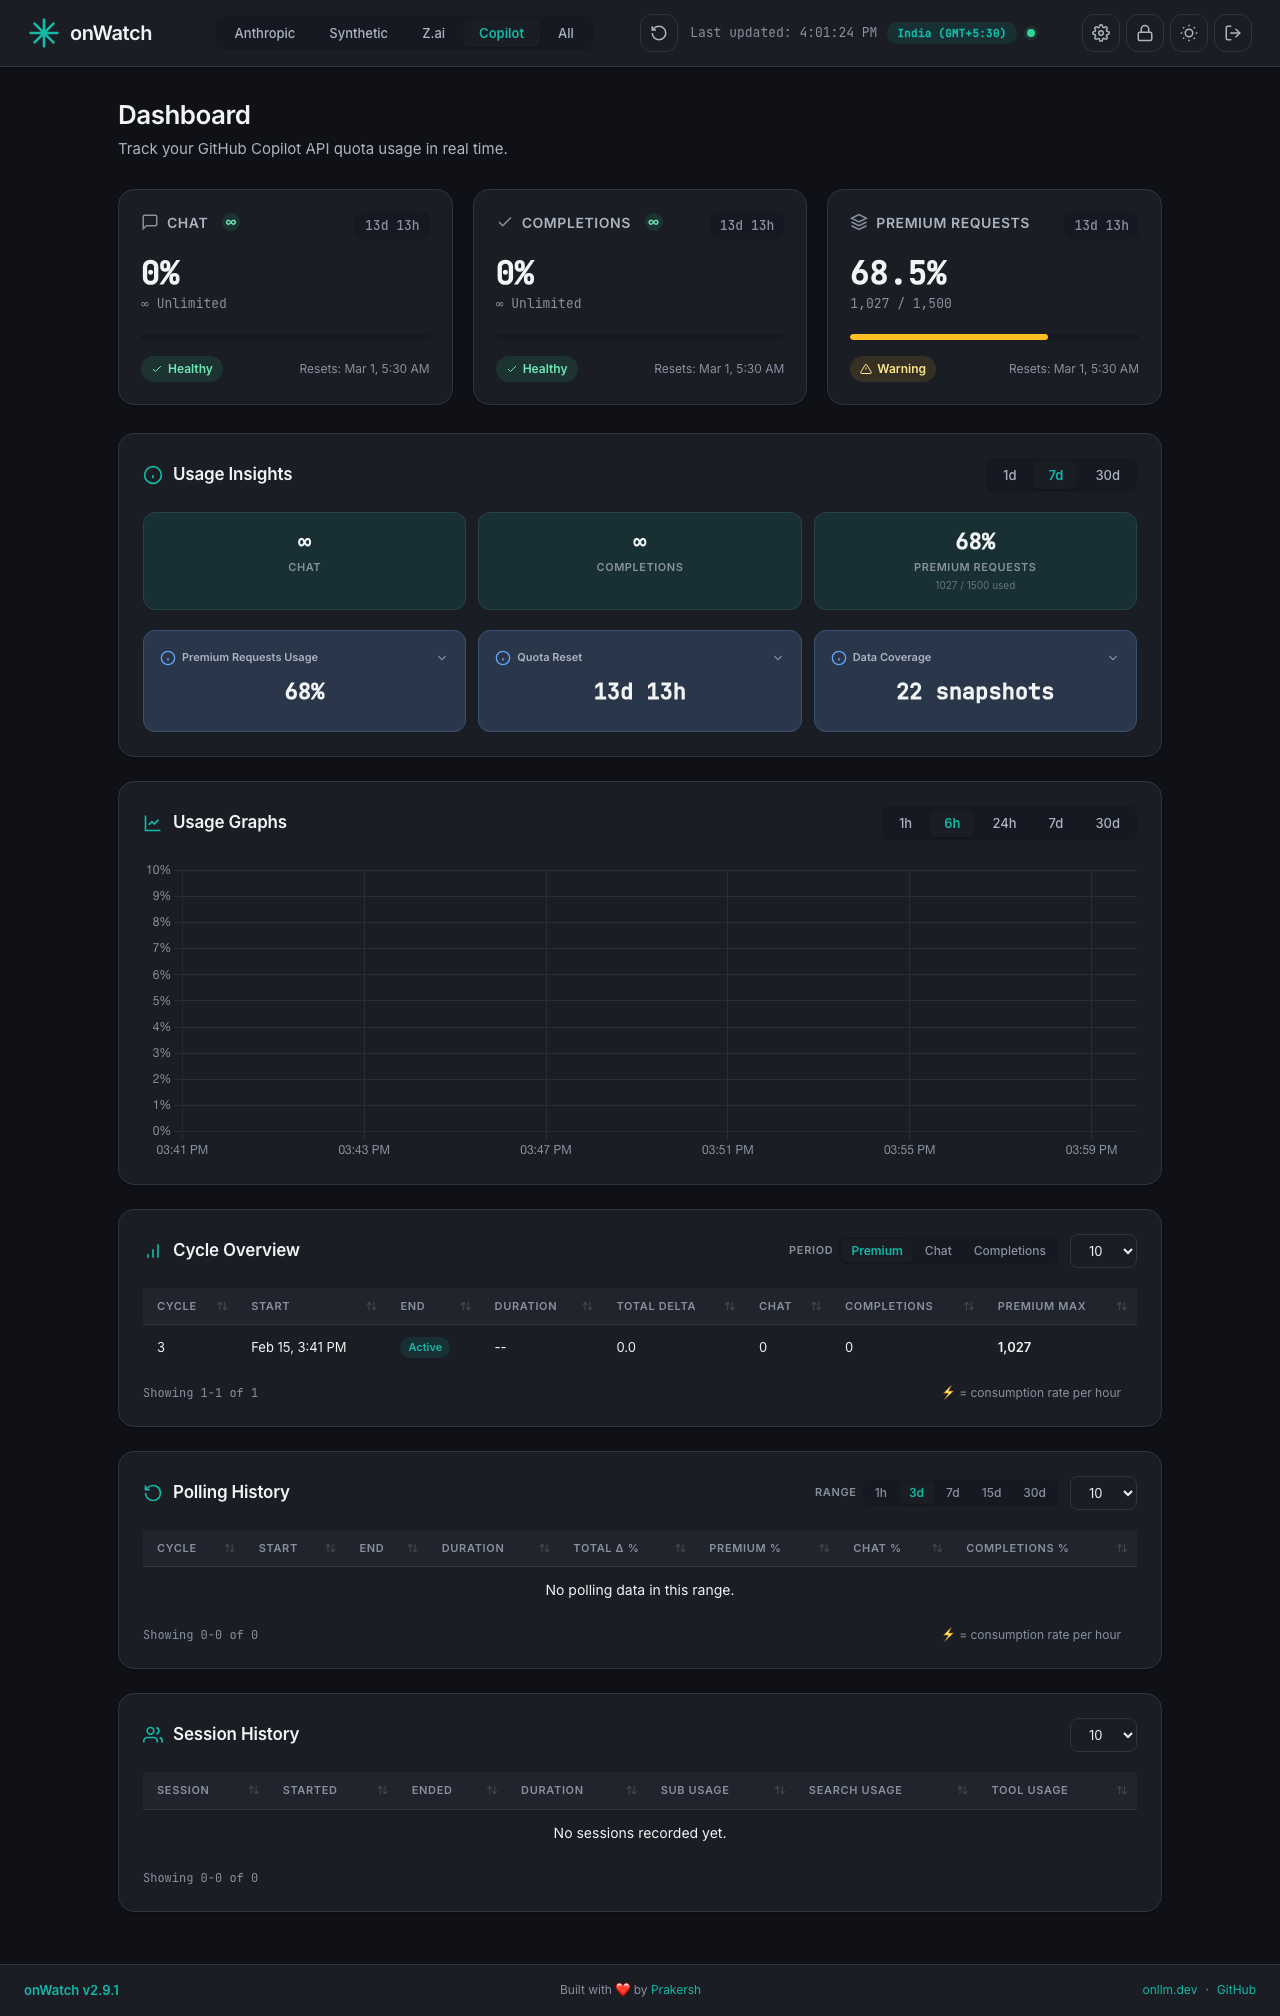
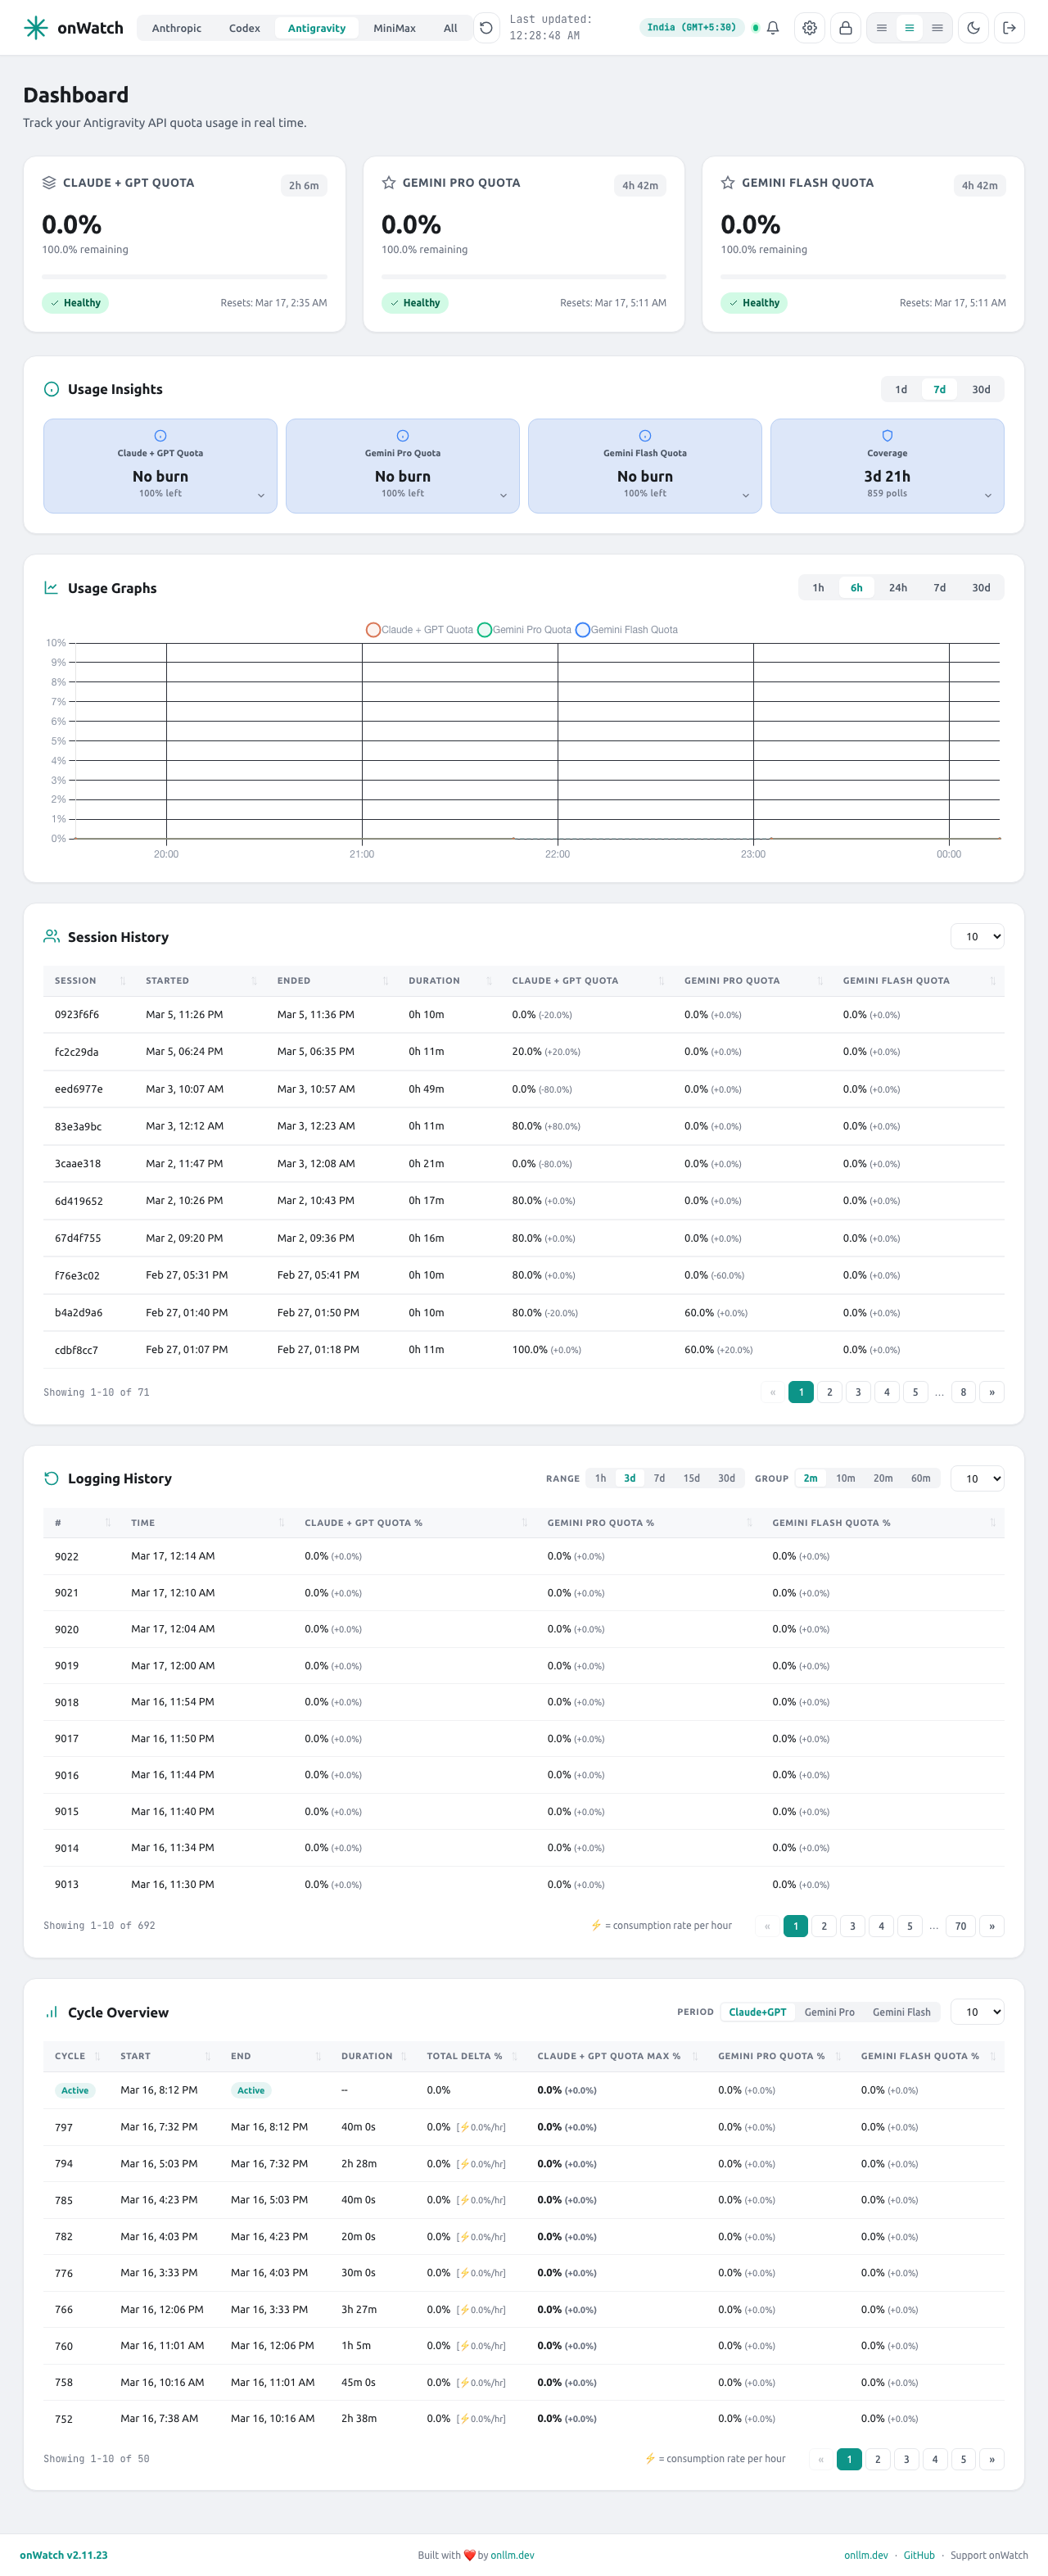
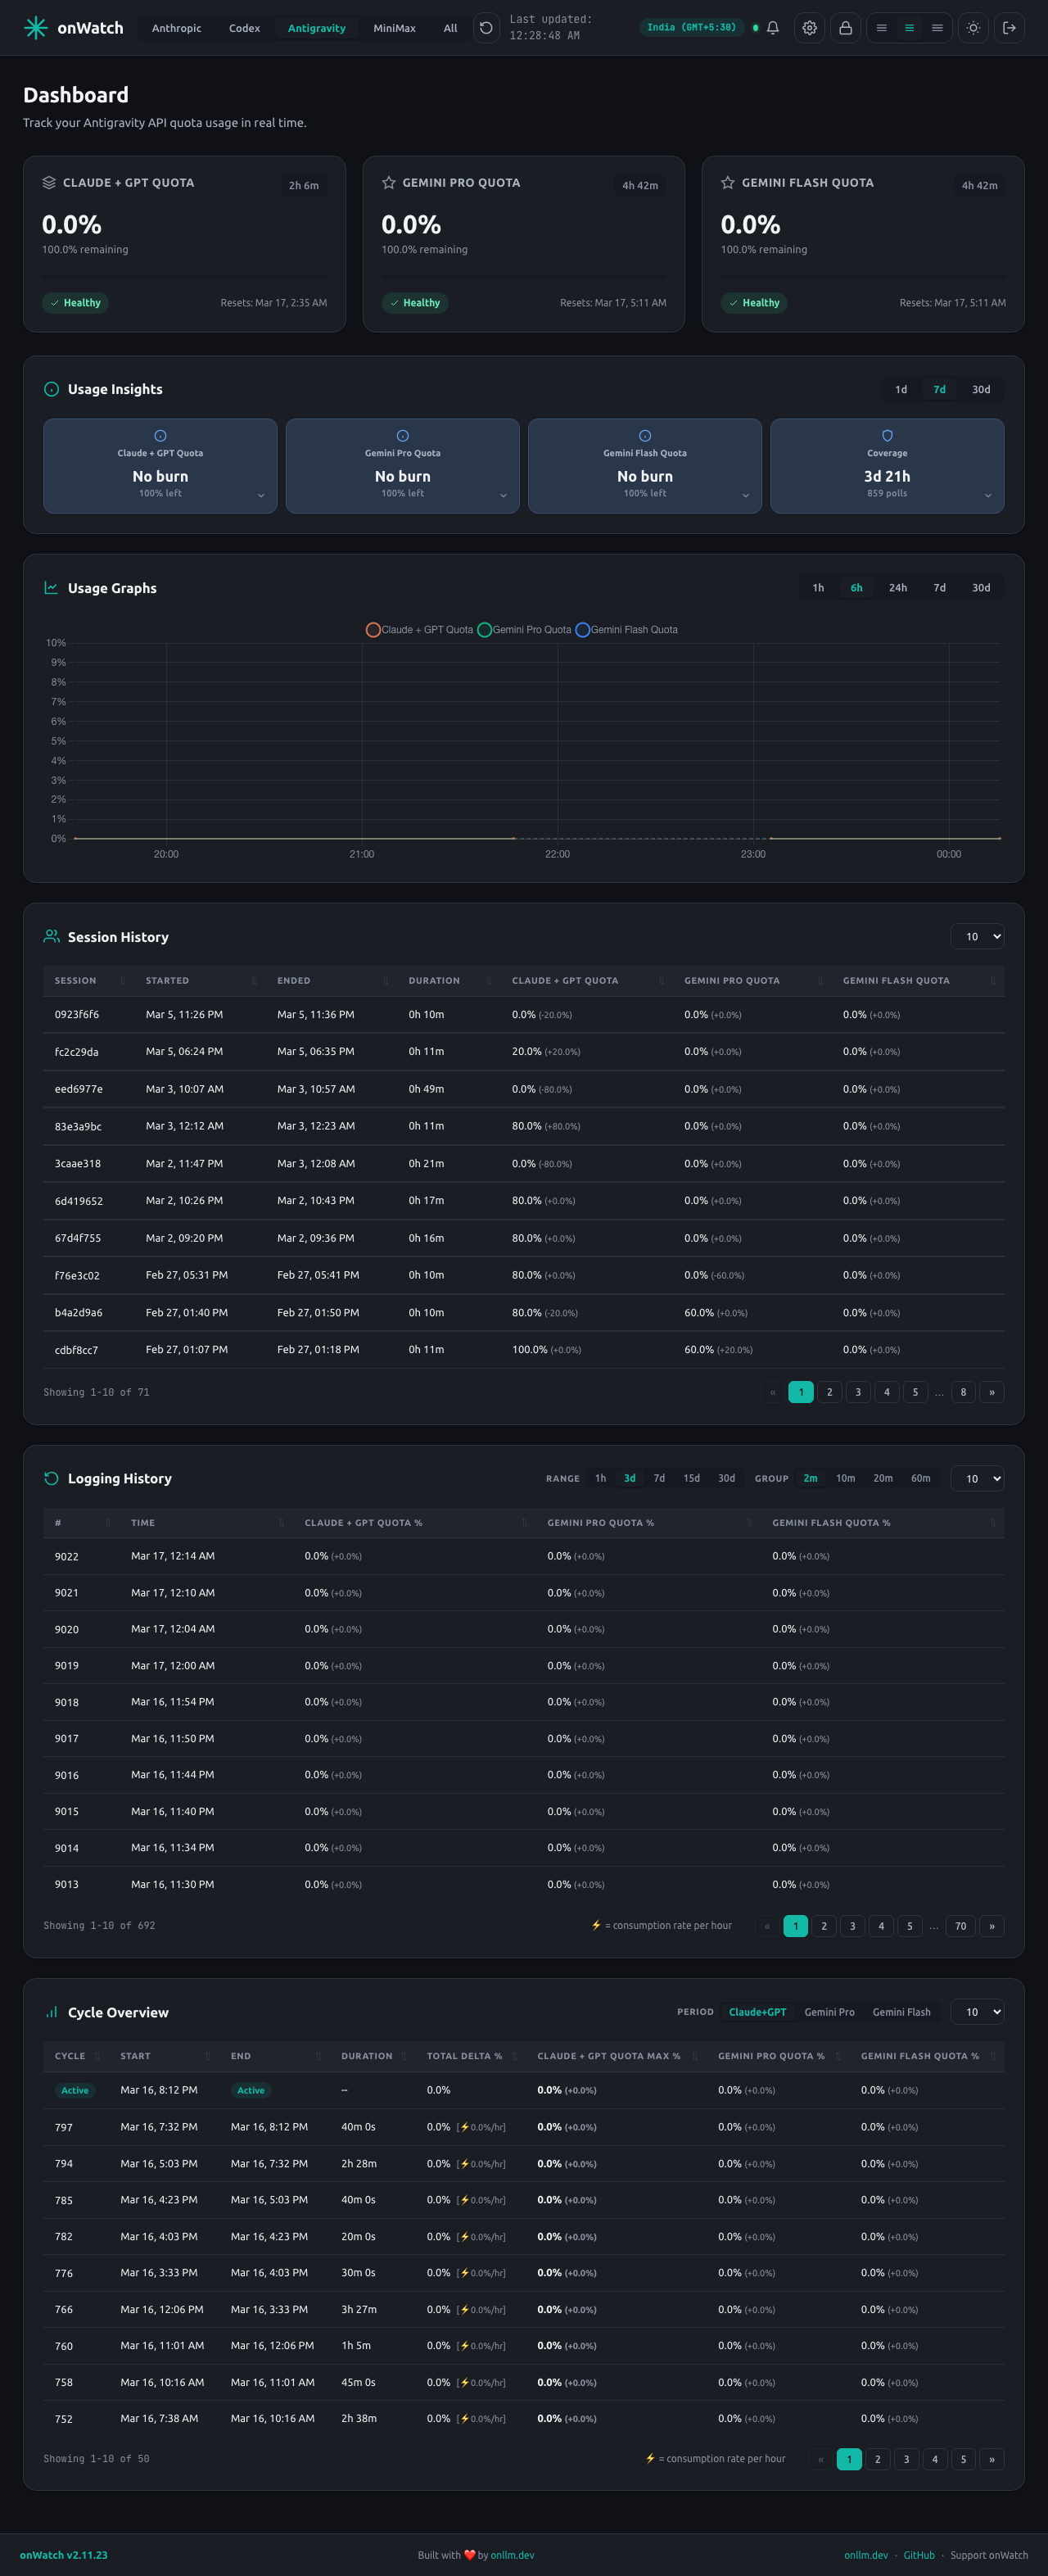
Live data from public GitHub stargazer profiles. Country spread, organizations, and preference at a glance.
Country spread
Interactive map is unavailable right now. Country coverage is listed below.
Star growth
Loading country aggregates...
Starred by employees of
Loading organization aggregates...
Public profile metadata only. Organization names are examples and do not imply endorsement.
Snapshot is stale. Showing neutral trust mode until refreshed data is verified.
Curated trust snapshot unavailable. Showing neutral trust mode.